

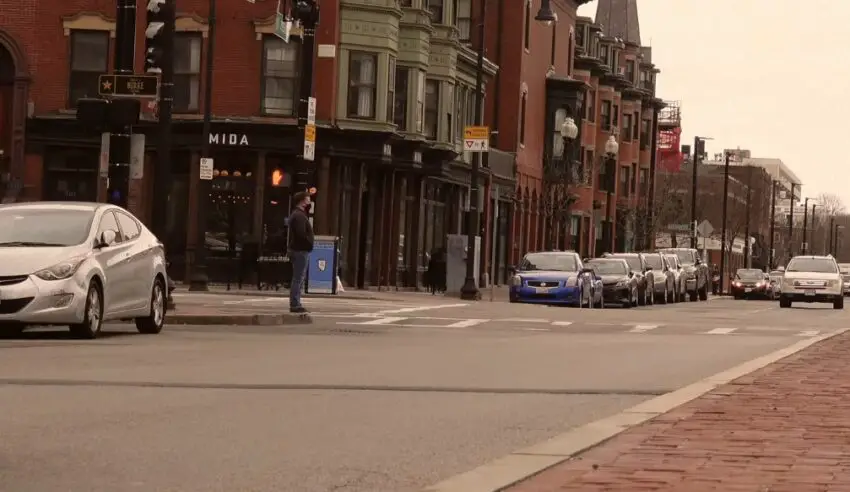
Boston, MA, is among the most important cities in the history of the United States. Not only it is among the oldest cities in the New World, but it is also a place where a high number of things of historical significance occurred.
While the city itself is not among the biggest ones in the country, it still holds a significant population. The population of the city is 654,776. However, the urban area has around 4.3 million. As is the case with any big city, it comes with both advantages and disadvantages.
Today, I would like to guide you through Boston’s crime rate and other relevant statistics.
Key Takeaways:
- Boston’s crime rate in 2024 is at 6.6 per 1,000 residents.
- With 4,293 violent crimes reported, more than double the rate for the state of Massachusetts.
- Boston achieved a record low murder rate in 2023 with 37 homicides, lower than the five-year average of 49.
Is Boston Considered a Safe City?
In 2023, Boston was voted as the nation’s second safest city, after Dallas, according to CBS News. I want to point out that the source cited by CBS was a Gallup survey, which focused on the opinions of ordinary citizens from all over the country.
In reality, whether a city is considered safe depends on various factors, including the specific area of the city, the type of crime being considered (violent vs. property crime), and the individual’s personal experiences or perceptions of safety.
When it comes to Boston, the landscape currently looks like this:
Boston’s crime rate in 2024 lies at 6.6 per 1000 residents, or 4,293 violent crimes, which is more than double that of the state of Massachusetts. At the same time, the number of property crimes was 14,489 in 2023.
The city has something to boast about since 2023 was the year when its murder rate hit a record low. There were only 37 homicides committed in the past year. At the same time, the District Attorney’s office states that it also resulted in
- 24 arrests
- 19 pleas
- 12 convictions
37 is much lower than a 5-year average of 49, according to the Boston Police report for 2023. Also, both fatal and non-fatal shootings have decreased in 2023 when compared to the year before. Fatal from 32 to 26, and non-fatal from 148 to 118.
Unfortunately, the same report states that the number of rapes has increased, from 186 to 194, as well as robberies, from 778 to 845.
How about Different Neighborhoods?
Putting all the neighborhoods in the city in the same category is practically impossible, for a variety of reasons like development, median income, and of course, crime rate. Let’s see what are the most dangerous and the safest ones out there:
According to Areavibes, the most dangerous neighborhoods are the following:
| Neighborhood | Violent Crimes | Comparison to Boston Average |
|---|---|---|
| Central | 1,468 | 137% more crime than city average |
| Roxbury | 1,162 | 88% more crime than city average |
| South End | 864 | 40% more crime than city average |
| Mattapan | 829 | 34% more crime than city average |
| South Dorchester | 773 | 25% more crime than city average |
| North Dorchester | 678 | 10% more crime than city average |
| Back Bay-Beacon Hill | 537 | 13% less crime than city average |
| South Boston | 449 | 27% less crime than city average |
| Hyde Park | 419 | 32% less crime than city average |
| Jamaica Plain | 416 | 33% less crime than city average |
Meanwhile, MovingWaldo talks about the safest parts of the city:
| Neighborhood | Population | Crime Rate |
|---|---|---|
| Winchester | 22,827 | 6.53 |
| Brookline | 59,057 | 18.13 |
| Somerville | 81,552 | 25.28 |
| Malden | 60,231 | 27.84 |
| Quincy | 94,519 | 38.33 |
How Does it Compare to Other Major Cities?
As Forbes writes, the city is currently the 13th safest city if we focus on those with a population higher than 300k. But how does this compare to violent crimes in other big cities in the country, according to Neighborhoodscout:
- Houston, TX – 11.35 / 26,149
- Los Angeles, CA – 8.38 / 32,042
- Phoenix, AZ – 8.23 / 13,529
- Chicago, IL – 5.38 / 14,344
- New York, NY – 4.29 / 84,469
Boston vs. the State of Massachusetts
In Massachusetts, the violent crime rate stands at 3.0 crimes per 1,000 people. This statistic has remained relatively stable from 2018 to 2023, with a significant spike observed in 2020.
Despite the state’s considerable population of approximately 6.9 million, the rate of motor vehicle thefts in 2022 was relatively low, with 7,211 offenses reported, and an arrest rate of 12.29 per 1,000, marking a slight increase of 3.02% from 2021.
But how does Boston compare to other cities in the state, according to Gitnux:
| City | Violent Crime Rate | Property Crime Rate |
|---|---|---|
| Fall River | 1055 | 3383 |
| Holyoke | 1038 | 2858 |
| Brockton | 865 | 2118 |
| Springfield | 1060 | 2706 |
| New Bedford | 822 | 2310 |
| Lynn | 704 | 2255 |
| Worcester | 648 | 2269 |
| Randolph | 501 | 1971 |
| Chelsea | 489 | 1653 |
| Lowell | 371 | 2086 |
Police Force in Boston, MA
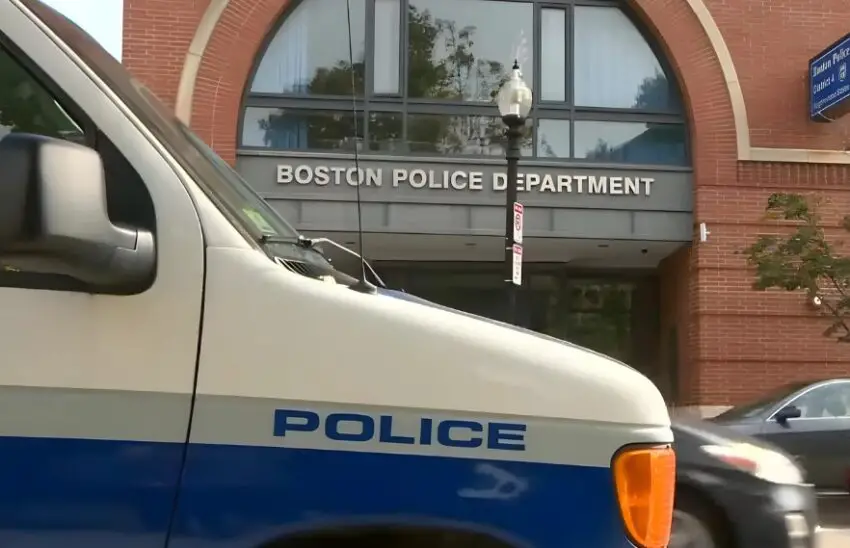
Several years ago, the Boston police force went through a crisis of numbers, due to a high number of policemen retiring. This situation raised concerns about the department’s ability to maintain public safety and respond effectively to the city’s needs. However, a concerted effort to address these concerns has led to improvements in staffing and operational capacity.
According to the Vera Institute, the city’s policing budget stands at $431,731,291, which accounts for 16% of the city’s funds.
This significant allocation of resources underscores the city’s commitment to public safety, translating to $595 spent per resident on policing. The police department’s employee-to-resident ratio is 1 to 229, indicating a substantial investment in law enforcement personnel relative to the population size.
The funding sources for the BPD are diverse, drawing primarily from Boston’s general fund. This fund is the city’s primary operating fund and is supplemented by additional financial support from local, federal, and state sources.
The funding structure supports the department’s operations, including personnel costs, training, equipment, and community policing initiatives.
The strength of police unions often makes it challenging to reallocate funds from policing to other areas, despite the potential for such shifts to reflect evolving community priorities and needs.
Methodology

Annually, the FBI releases two sets of crime data: an initial report focusing on the country’s largest cities and a more detailed report at the year’s end. We used the latest available data from the FBI’s 2022 Crime in the United States Report. We plan to update our findings with the new data expected in September 2024.
Our study focused on two main indicators:
- Violent Crime Rates Per Capita
- Property Crime Rates Per Capita
We aimed for a balanced analysis by considering mainly the city of Boston, but other cities in the state of Massachusetts
Final Reflections
As you can see, Boston is a safe city by US standards, especially when it comes to the big cities.
The city’s crime rate is only slightly higher than the national median rate, which indicates many things.
At the same time, the police force has a high budget that ensures the safety of the citizens.
I am Lazar Bojic, an established professional in digital marketing with almost a decade of experience. Specializing in an array of niches has been my main strength as a content creator. Besides being a content writer, I have participated in creating various other content types, including infographics and script writing for video content creators, across numerous niches. Among my standout works, content creation at wikibiography.in certainly holds a special place.